August 2026 Hay Report
Date: August 8, 2026 Market: Southeast Colorado Premium large-square alfalfa, $/ton ex-stack (McClave / lower Arkansas Valley) Replaces: the July 11, 2026 forecast. Full grading, audit, and data trail in research/10-forecast-update-2026-08.md.
The Bottom Line
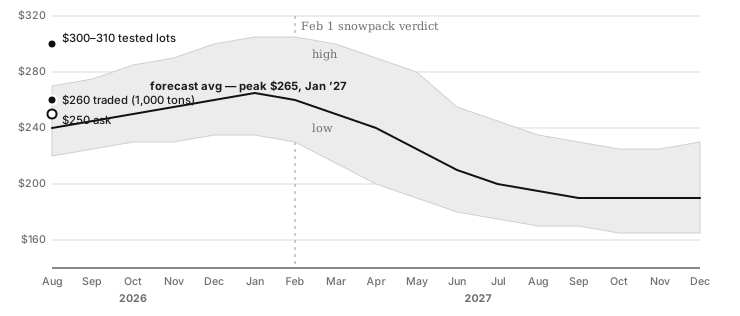
The market did what we forecast in July — and then some. Colorado alfalfa (state average) came in at $210/ton for June, a second straight $20 monthly jump and the fastest two-month climb since 2022. In the cash market, SE Colorado first-cut asks are at $250, quality lots are trading $300–310 into dairies and stables, and every surrounding state repriced upward in the last month: Kansas grinding hay +$50/ton since June, Nebraska +$20–40 in two weeks, Wyoming +$30. Our July price bands held for the fourth straight graded month — but trades are landing in the top half of them, so this month we raise the forecast about $5–10/ton through January and sharpen the peak: about $265/ton average in January 2027, inside a $235–305 range.
The reason for the raise is a lesson in honesty: July's report trimmed the winter forecast on three bearish demand facts, and within four weeks two of them reversed and the third was mismeasured. Oklahoma re-dried fast (drought coverage jumped from 44% to 60% of the state in the first week of August), diesel rebounded 17%, and the "cheap Kansas hay" cap was built on a lagging government average of $123/ton while actual Kansas cash markets were marching to $200–210. The water story didn't change: the local supply catastrophe is fully confirmed (we now estimate Colorado's 2026 alfalfa crop at about 1.5 million tons, down about 36%), and the very strong El Niño that should end this market with a fat spring snowpack got even more certain. Ride the winter strength; the exit rules stand — if December 1 snowpack is at or above normal, sell everything by Christmas, and never hold past the February 1 snowpack reading.
Report Card: How Did July's Forecast Do?
We put the scorecard ahead of the forecast because the forecast is only worth what its track record says it's worth.
What we got right:
- The price bands held — 4 for 4 months graded so far. July's row said $210/$230/$260; commercial trades came in at $250–260 with small quality lots above. June's USDA state price ($210) confirmed the June row landed upper-half. The April seller's-ask call ($225 defensible) has been vindicated by an actual $225 contract, then left behind by the rally.
- The monsoon lean. July said the monsoon was arriving and leaned bearish-local; July delivered 6.60" combined at Lamar + Las Animas (our >6" trigger), the Fort Lyon Canal partially restarted on storm flows, and Bent County's worst drought categories shrank.
- The El Niño structure. The forecast's biggest architectural decision — cutting the spring-2027 blowout because a very strong El Niño favors a fat 2026-27 snowpack — got stronger: forecasters now put it at 100% through winter and 94% into spring, with 23 of 26 models calling for a top-tier event.
- The advice. Selling the middle tranche into $235–250 strength left perhaps $10–20/ton on the table versus waiting — within our stated error bars, and the insurance was the point.
What we got wrong — and fixed this month:
- Diesel, twice. April missed its fall; July called it "falling" at $4.58 and it's $5.35 now (+17%). We've stopped forecasting diesel; we use the current posted price.
- The Kansas cap was measured off stale data. The mechanism (SE Colorado feedlot hay trades near Kansas-landed parity) was right; the level was off ~$60–65/ton on a landed basis, because we used a lagging state average ($123) while cash markets traded ~$80 higher. This month's report surveys every surrounding cash market directly — see the map below.
- Oklahoma's re-dry came faster than our "watch item" implied. OK drought coverage jumped 16 points in one week; the nearby demand pull we wrote off in July is coming back.
- An error we made and un-made inside 24 hours — worth telling on ourselves: an earlier draft of this report claimed USDA dropped hay from the August Crop Production report and moved the first production number to January. That was wrong — a broken search tool returned empty results on files that in fact contain the hay tables, and we built a confident "correction" on it. The stored USDA files themselves settle it: hay production forecasts come out every August. So the real schedule is: first official 2026 forecast Aug 12 (four days after this report — a direct, immediate test of our estimate below), final number January 12, 2027. Our prediction for the Aug 12 number was written down in advance. Process fix: any claim that would reverse a prior report's factual statement now requires two independent verification methods before it ships.
Bottom line on credibility: every published price so far has landed inside our bands, but both reports' errors have been on the demand side, and July's all leaned the same (bearish) way. This month's raise corrects that lean with measured cash prices, not gut feel.
Price Prediction
| Month | Low | Avg | High | Confidence |
|---|---|---|---|---|
| Aug 2026 | $220 | $240 | $270 | High — current asks $250; band measured from cash markets |
| Sep 2026 | $225 | $245 | $275 | High-Med — 3rd cutting partial at best; August rain verdict pending |
| Oct 2026 | $230 | $250 | $285 | Medium — early feeding (pasture 76% very-poor/poor) |
| Nov 2026 | $230 | $255 | $290 | Medium — winter demand vs. KS/NE imports, both repricing up |
| Dec 2026 | $235 | $260 | $300 | Medium — stocks down 32% + failed-crop squeeze; Dec-1 snowpack rule |
| Jan 2027 | $235 | $265 | $305 | Medium ← forecast peak |
| Feb 2027 | $230 | $260 | $305 | Medium ← snowpack verdict month, widest band |
| Mar 2027 | $215 | $250 | $300 | Low-Med — relief anticipation if snowpack is 90% or better |
| Apr 2027 | $200 | $240 | $290 | Low-Med — reservoir refill priced in |
| May 2027 | $190 | $225 | $280 | Low-Med — first 2027 cutting |
| Jun 2027 | $180 | $210 | $255 | Low-Med |
| Jul–Dec 2027 | $165–175 | $190–200 | $225–245 | Low — normalization, but above 2025 lows |
State-average NASS alfalfa runs ~$35–55 below this grid (all qualities, all bale types, statewide). Honest uncertainty on any single month is ±$25–30/ton — the statistical model's advertised precision is tighter than its real forward skill, so we widen by hand and say so.
Why the Price Is What It Is
Think of the McClave price as pinned between a floor and a ceiling, both set by trucks.
1. The floor: what grinders and ranchers will pay to haul hay OUT (~$210, rising)
Southwest Kansas grinding alfalfa — the cheapest substitute of scale — trades at $200–210/ton FOB, up $50 since mid-June, and nets $180–190 back to a McClave stack after freight. Northwest Oklahoma Supreme is asked at $200–210 within 175 miles (asks, not confirmed trades — landed ~$226–236). Record cattle money (feeder steers $437–495/cwt at Oklahoma City; the Nebraska report says ranchers are now outbidding dairies) keeps this bid firm and rising. Nothing Premium-quality in SE Colorado should clear below ~$210 ex-stack.
2. The ceiling: what it costs to haul substitutes IN (~$250–270)
A feedlot or dairy that balks at local prices can land New Mexico dairy hay for ~$249, SW Kansas dairy hay for ~$272–282, or take NE Colorado new-crop offers netting $190–200 to the seller. With milk at a mediocre $16.97/cwt, dairies won't chase hay much past that. This is why the observed SE Colorado ask is $250 — sellers are pricing right at import parity. The $300–310 sales are the tested-and-covered retail/dairy channel (real, but small lots), not the marginal trade.
3. Local supply: the worst water year in recorded history, now quantified
- Arkansas Valley (the seller's region, ~20% of the state's alfalfa): catastrophic. Fort Lyon Canal essentially dry all July (running 0–82 cfs opportunistically on storm flows as of Aug 8); zero Fry-Ark allocation; John Martin Reservoir down to 23,100 AF (~6.6% of pool) on 1.6 cfs of inflow — still draining despite the monsoon.
- Western Slope (~23%): severe to catastrophic. Uncompahgre Project "worst on record" with ~40% of project ground fallowed; McPhee/Dolores shareholders at ~half supply; mountain grass hay trading $300/ton.
- San Luis Valley (~16–20%): partial. Surface water collapsed (~28% of median runoff) but ~3,000 wells kept pumping under only a 5% curtailment — the 2026 crop got made, at rising cost. (The aquifer lawsuit threatens 2027+, not this year.)
- South Platte / NE plains (~38–40%): near-normal. The C-BT quota came in at 80% — above average — and South Platte reservoirs held 90–100% of median. This is why the state didn't simply run out of hay, and why NE Colorado is the only region trading dairy volume.
Net us out: we estimate Colorado's 2026 alfalfa crop at ~1.5 million tons final, down ~36% from 2025 (range 1.35–1.7 million), from roughly 555,000 harvested acres (farmers intended 660,000; drought analogs shed 12–17%) at ~2.80 tons/acre (2002 and 2022, the two modern collapse years, both came in at 2.90). USDA's first in-season forecast comes out August 12 — expect that number higher than our final estimate (about 1.75 million predicted): in a worsening drought the August survey runs high because acres are still being abandoned (August 2022 said 2.0 million; the final was 1.77 million). The January 12, 2027 report gives the final. Colorado entered this failed season with hay stocks already −32% year-over-year. Pasture condition is 76% very-poor/poor — twice as bad as drought-2022 at this date — which means winter feeding starts early and runs long.
4. Demand: capped above, crowded below
- Cattle: record prices, cycle-low cow numbers, no herd rebuild before ~2028 — ranchers have the need and the money, and dead pasture forces them to start buying in October, not December.
- Dairy: the US herd is at a 30-year high, but $17 milk caps what they'll pay — dairies set the ceiling, ranchers set the floor.
- Nearby drought demand is returning: Oklahoma jumped to 60% drought coverage in a week; the Texas Panhandle is 5–9°F above normal with dying grass and depleted ponds. The bidding radius that collapsed in June is re-expanding.
- Exports: non-factor. China's offtake is the weakest since 2020. (The tariff truce expires Nov 10 — headline risk for western exporters, roughly neutral here.)
5. The clock: El Niño ends this market in the spring
Everything above says higher into winter. The reason the forecast turns down after February is the same as last month, now firmer: a very strong El Niño is locked in for winter (100% odds through February, 94% into spring; 23 of 26 models call a top-tier event), and strong El Niño is historically the most favorable pattern for southern-Colorado snowpack. The one time this decade the snowpack came in fat (2024), Colorado alfalfa fell $60/ton in a year. We put ~3-in-4 odds on that snowpack arriving. The 1-in-4 residual — a dry El Niño, like 2015-16 — is what the February high band ($305) is for.
6. What to do with hay in the stack
The path is a rising wedge into January (~$265), a verdict in February, and a managed descent after. Hold remaining inventory into the November–January window — the rising floor (Kansas +$50, record cattle, Oklahoma re-drying) has made waiting safer than it was in July. Split the stack by grade: tested Premium+ lots belong in the $300 retail/dairy channel in small lots; the rest prices off the feedlot curve. And the two discipline rules are unchanged: if December 1 snowpack is at or above normal, sell everything by Christmas; in no scenario hold past the February 1 snowpack reading.
What We're Watching (next report ~early September)
| Date | Event | Why it matters |
|---|---|---|
| Aug 12 | USDA Crop Production — first official 2026 hay forecast | Direct test of our 1.5-million-ton estimate (we predict USDA's first number reads about 1.75 million) |
| Aug 13 | AMS Colorado hay report | Do $250 asks convert to trades? |
| Aug 13 | CPC El Niño update | Confirm the very-strong track |
| Aug 21 | AMS Kansas/Oklahoma/Texas reports | Is the floor still rising? |
| Aug 31 | USDA July price (NASS) | A third straight $20 jump would confirm the high end |
| ~Sep 1 | August rain total, Lamar + Las Animas | Aug 1–7 was 0.02" — if August stays dry, the 3rd cutting dies and Sep–Oct trade the high band |
| Dec 1 | Basin snowpack | The sell-by-Christmas rule |
| Jan 12 | USDA annual production + Dec 1 stocks | Final check on our 1.5M-ton estimate |
| Feb 1 | Basin snowpack reading | The final exit gate |
Data as of August 8, 2026. This month we re-verified the data foundation from primary sources: USDA NASS price reports re-downloaded and matched 4-for-4 against our series; acreage/production analogs read from the printed 2003/2013/2023/2026 annual summaries; all water, drought, and climate readings fetched directly from USACE, Fort Lyon Canal Co., Colorado DWR, US Drought Monitor, ACIS, NRCS, and CPC/IRI; surrounding-market prices from the AMS direct-hay reports for KS, NE, NM, OK, WY, TX, and CO (Jul 30–Aug 7); freight from DAT flatbed averages. Known soft spots are flagged in research/10-forecast-update-2026-08.md, section 10, including: thin AMS coverage of SE Colorado, freight estimated from all-commodity rates, and the July NASS state price not publishing until Aug 31.